
Risk
The Flip Side of Return

Got a New Book (Review Coming Up in Awhile)
I mentioned last week that I found out I won a copy of the book “The Founders: The Story of PayPal and the Entrepreneurs Who Shaped Silicon Valley” by Jimmy Soni. Well, it arrived today (well, technically yesterday as you’re receiving this very early on Wednesday morning). There will be a review up (in awhile…it’ll take a bit to get through it), but in the meantime, a big “Thank You” to Liberty and Jimmy Soni!

Last Cancer Update for Awhile
I’ve finally had my last radiation treatment (Friday) so now it is onto chemo. Overall, the radiation went quite well. My head did start to get a bit itchy near the end (which I suppose might have something to do with radiation being beamed at it 😀) and lost a little hair, but that was about it. Took the last baby chemo dose today (ready for a little break there as well), so now we wait until March 27th/28th to get started with the next dose. It’ll be nice having a break from treatment for most of the month. Next round is the MRI on March 21st, followed by Drs. appointments on the 22nd and 23rd. So, I’ll post an update then (that week the update may be a day late to get the 23rd results in).

Risk — The Flip Side of Return
Today we’re going to talk a little bit about risk. If you recall, we talked about expected return way back in September 2021 (Expected Return — really, take a second to look through that one if you haven’t done so yet). Today, we’re going to flip things around a bit and talk about risk. Unfortunately, we don’t have great ways of measuring risk because risk is about what we EXPECT to happen and, quite frankly, we don’t know what might happen. Therefore, our measurements of risk are all based on past experiences. And, as the Thanksgiving turkey demonstrates, that may have some issues.
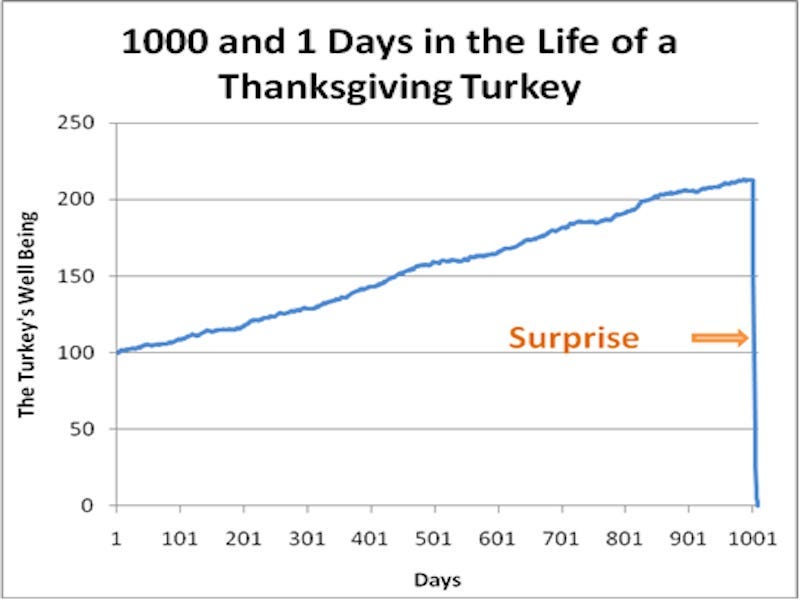
As you can see. Things are looking pretty good, right up to the point that they aren’t (although, I’m not sure that the average turkey’s life is always getting better right up until their death). Therefore, basing risk on what HAS happened is probably going to be imperfect. Ideally, we’d prefer to know what is GOING to happen. That said, my Magic 8 Ball is probably not the solution.

Given that we don’t have a perfect solution, let’s look at some of the solutions we do have.
Range
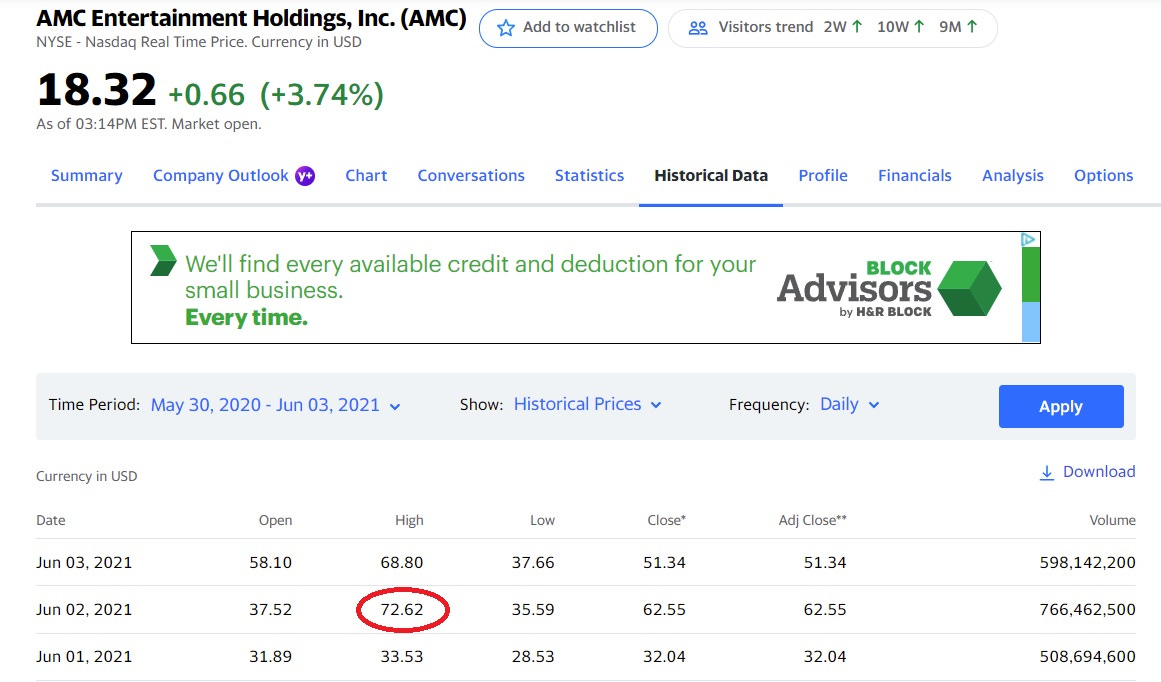
The range just looks at all possible outcomes — essentially the low to the high of all possible outcomes. So, for a given common stock, the bottom of the range would be -100% and the top of the range would be unknown. Now, practically, we know that it isn’t going to be truly unknown, because there are limits on how much a stock can grow. However, sometimes we can get surprised. AMC Entertainment Holdings (AMC) traded as low as $2.14 at the start of 2021. It also hit a high of of $72.62 on June 2nd, 2021! Over the previous 5 years, the range was between $1.91 and $32.10. Then in the next 6 months the range went from $1.91 to $72.62. Clearly the previous 5 years had not prepared people for how high (or why) AMC stock rose. It is currently trading back around $17-$20. The basic idea is that we do know stocks can only lose 100%, but we don’t know how far they can rise.
Standard Deviation
One of the more popular tools in finance to measure risk is the standard deviation of returns. This is calculated as follows (source is ThoughtCo)

So, for example, let’s say the returns for my last 4 months are -10.1%, 12.2%, 13.3%, and 1.1%. Then, my standard deviation would be 10.96%.1 A couple of important notes. First, this shows a normal distribution. Stock returns are NOT normally distributed. Instead, they tend to have fat tails (more extreme ups and downs than would be predicted by a random distribution). They also are not centered around 0%, but instead around 9-11%. Again, this is a useful model, but can run into a major problem. Essentially a normal distribution says that the higher the standard deviation, the greater the risk.
Imagine that I have two potential draws:
draw 1 — -50%, -5%, 15%, 60% (equal opportunity for any of the 4)
draw 2 — -50%, -5%, 15%, 65% (equal opportunity for any of the 4)
Draw 1 has an expected return of 5% with a standard deviation (assuming these are all the outcomes so we divide by n instead of n-1) of 39.53% while draw 2 has an expected return of 6.25% and a standard deviation of 41.29%. So, it looks like you’d be indifferent between these two outcomes. However, the “risk” of draw 2 is that it offers one shot with a higher return. That is a good outcome, not a bad one. Everyone should take draw 2 because the “downside” is a higher return.
Coefficient of Variation
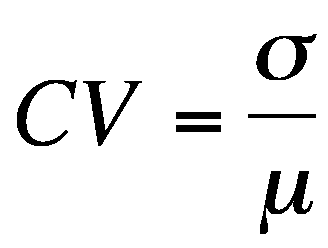
Another statistical tool to compare risk-return is the coefficient of variation. Specifically, the coefficient of variation is calculated by taking the standard deviation divided by the mean.
If portfolio A has a standard deviation of 25% and a mean return of 10%, it’s coefficient of variation is 2.5. Then consider portfolio B with a standard deviation of 30% and a mean return of 9%. It’s coefficient of variation is 3.33. Therefore, portfolio A is a better investment (lower coefficent of variation). However, how are we determining the coefficient of variation? Are we using the past 5 years, 10 years, 15 years or some other measure of data? What if the results from the past 5 years show portfolio A is superior and the results from the past 15 years show portfolio B is superior? How do we decide? What about the results for the next 5 years? What if the coefficient of variation is close say 2.5 vs. 2.6? Is that really different or not? As you can see, there are a few problems with coefficient of variation.
Value at Risk (VaR)
Value at Risk (VaR) is looking at how likely are we to have a loss that exceeds our VaR. For example, if I have a 5% VaR of losing 3% on any given trading day that tells me that there is a 5% probability of losing 3% or more on a particular trading day. This allows a risk supervisor to assign VaR levels to appropriately manage the risk of the larger portfolio. There are three primary ways to measure risk. One is to just use historical data. The second is to use historical variance/covariance matrices. The third is to use Monte Carlo sampling where historical data is used, but instead of just using sequences, it generates random samples and then presents a breakdown of the samples. I’ll talk more about this in a minute. That said, the biggest problem with VaR is that it doesn’t tell you how big your loss could be. For example, I could have a VaR with a 3% loss, but the worst case scenario is a 10% loss. Alternatively, I could have a VaR with a 5% loss, but the worst case scenario is a 100% loss.
Also, it ignores the way markets work. Oftentimes, the risk of today’s trading is based on how risk yesterday’s trading was. Let’s take a look at S&P 500 returns from October 1st, 2008 - March 31, 2009 (a total of 124 trading days). During that time period, there were 10 trading days where declines in the S&P 500 exceeded 5% losses (as well as 8 periods where returns exceeded 5% gains). If we then extend the period from March 31, 2009 through March 31, 2015 (6 years or 1509 trading days), there was 1 period with a 5% loss (-6.51% on August 8, 2011) and 0 periods with a 5% or more gain (see spreadsheet for data). So what is our VaR?
Again, we have a solution, but it has it’s own set of flaws.
Monte Carlo Simulation
A Monte Carlo simulation just allows you to look at a variety of possible combinations pulled from a random sample. For example, when you put in the expected return and standard deviation it creates a large sample to draw from randomly. Then it repeats this thousands of times (it is not uncommon for it to draw 10,000 random “trials”) and shows you the results. This is a powerful tool, but also creates it’s own set of problems. Specifically, it is not telling you what WILL happen, but giving you 10,000 “trials” of results (honestmath.com uses this technique). Unfortunately, it doesn’t tell you which of the 10,000 outcomes will occur. See the episode titled Building a Simulation in Excel for a great discussion. Will it be one of the great ones or one of the awful ones? You don’t know.
Historical Data Does Not Imply Future Results
Let’s go back to the beginning and recognize that all of these models are based on historical returns. As we get more data, we get a better picture of possible outcomes. However, keep in mind that interpreting data is a challenge. First, we have the Thanksgiving turkey problem. Everything looks great…until it doesn’t. What happens when we end up in a Russia/Ukraine situation? BP is exiting it’s 20% stake in Rosneft over the Russian situation. What will they get for selling it (assuming there are buyers)? Likely less than it’s worth, but more than the worth plus the negative image associated with owning it.
Second, times change and so to may investment returns. We often think of the Treasury bond as a “risk-free” investment. This implies that you are earning the risk-free rate. Right now, the 10-year yield is 1.84%…and we pay taxes on that. Assume a 25% tax rate and you are down to a 1.38% yield. What was inflation recently? 4.7% in 2021. So, now you are down to a yield of negative 3.32%? Yes, I know that assumes inflation will stay at 4.7% for the next 10 years which is likely not correct, but even if it averages 2% that results in a negative yield. What will happen to returns? Will they keep averaging 9-11% or be lower? What about returns from other countries? What is a fair return for owning Russian assets at the moment? How about Chinese assets? No one knows the answer to these questions.
The point is that we can approximate measurements of what risk has been. However, it is really tough to KNOW what risk will be.

Note that this is way too short of a data sequence to be meaningful. Also, the (n-1) denominator is playing a big role in making the sequence bigger. This is because 4-1 = 3 whereas with 2 years of monthly data, I’d have 24-1 = 23. The difference between dividing by 3 (vs. 4) and 23 (vs. 24) is pretty significant. You can do the calculation as follows:
s = sqrt([(-10.1 - 4.125)^2 + (12.2 - 4.125)^2 + (13.3 - 4.125)^2 + (1.1 - 4.125)^2]/(4-1)) = 10.96%
Glad you're feeling better, Kevin. Take time as you recover from cancer. I appreciate your content. Thank you for posting all of this material. It's greatly appreciated.