TL;DR Summary
Finance tends to involve lots of math and is a difficult major
The combination of math fears by many students (including college students) and learning a challenging, new field can make students fall into the trap of thinking the formulas are the point of finance. They aren’t. Instead they are tools.
The problems with formulas is that they assume we KNOW the inputs…and we don’t.
The formulas are the tools that help us provide a structure for our story. The goal is to tell a reasonable story about how you think the future is going to unfold, why it is going to occur in that manner, along with both what could go wrong with your story and how likely those are to occur.
Worry less about the precise results of your formulas and more about understanding the story you are telling along with implications of that story.
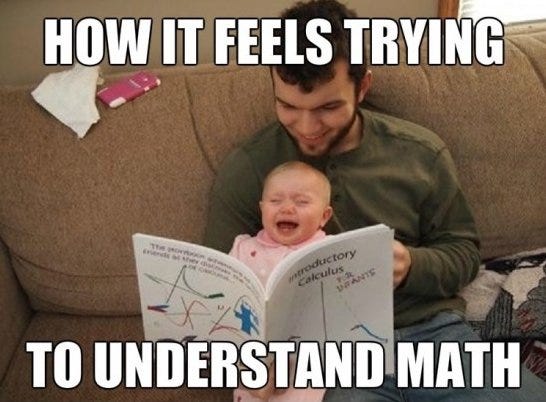
One of the bigger challenges in teaching finance is that finance involves a lot of math. Most people feel somewhat like this when it comes to math
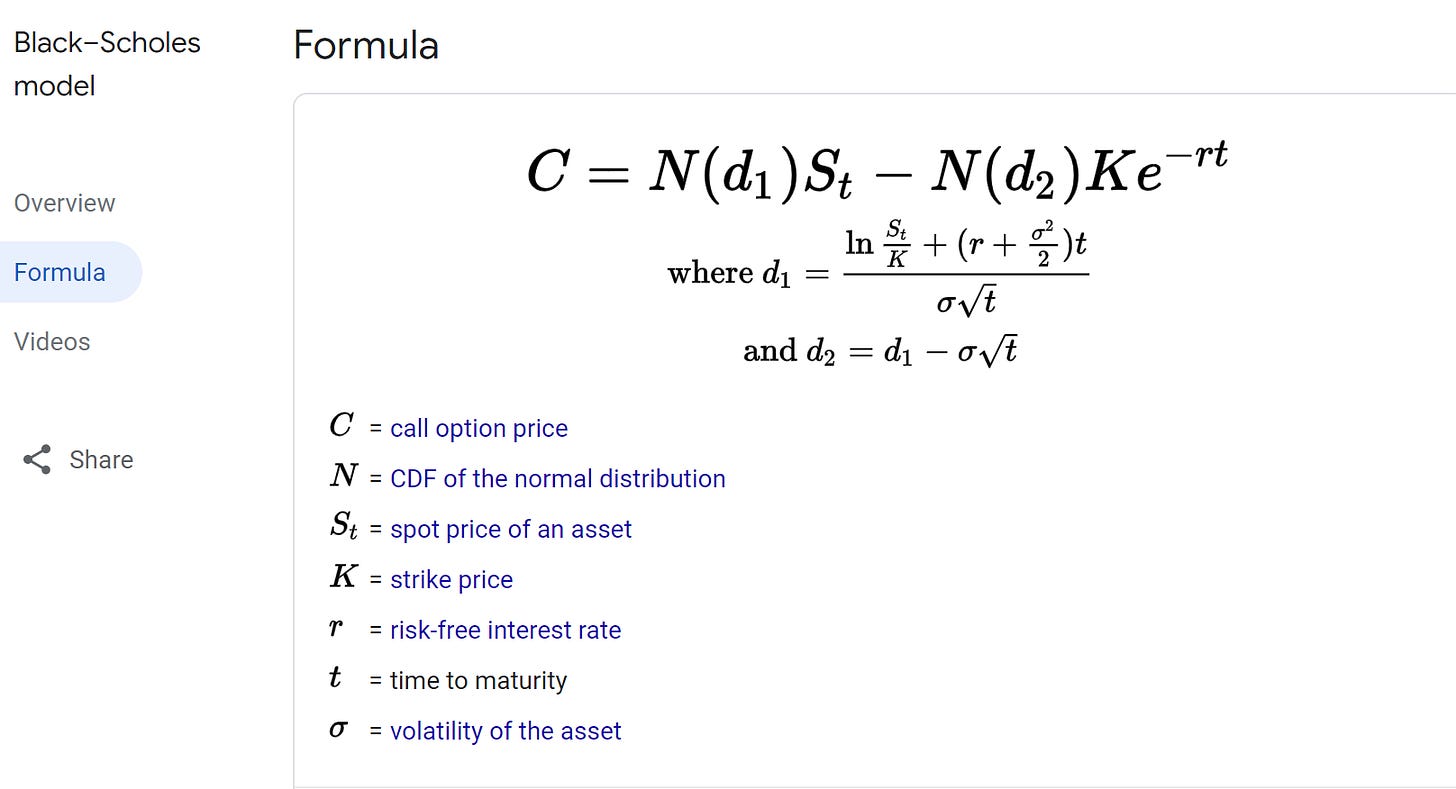
When we throw up a formula like this1
their heads really start to spin. Math phobia is real. In a Harvard Business Review article from 2019, Sian Beilock notes
In the United States, it is estimated that a quarter of students attending four-year colleges experience moderate or high levels of math anxiety. And one study found that, for 11% of American university students, the anxiety is severe enough to warrant counseling.
In addition, finance is not exactly an easy major. In one listing of 124 college majors ranked by difficulty, finance was the 15th most difficult, harder than 89% of other majors (slightly more difficult than the 19th-ranked aerospace engineering — meaning it may not be rocket science as rocket science is actually EASIER!)
Imagine yourself as a 20-year-old college student, sitting in your first finance class with some crusty professor droning on about expected return, standard deviation, correlations, and beta. Or the following year, getting into discounted cash flow (DCF) models and derivatives like the Black-Scholes Option Pricing Model
All of a sudden, you are hoping to be able to remember formulas and do the calculations on exams and forget that finance is more about telling a reasonable story rather than just doing calculations. If the value of a stock is equal to the present value of all the expected cash flows that the company is going to generate over its lifetime discounted back to today at an appropriate, risk-adjusted rate of return (phew…I’m out of breath), then figuring out what a stock is worth is easy. All you have to do (please read those previous five words with a high degree of sarcasm) is
Forecast every cash flow the company is going to make between now and the end of time.
Forecast the exact time each of those cash flows will be received
Choose the correct discount rate that accurately captures all the inherent risk of each cash flow and
Solve for the present value.
Imagine doing this for Disney. What movies are they going to make and when? How much will each of these movies cost? How well will they do at the box office? What will happen at their theme parks? How will they monetize Star Wars across Disney+, the parks, movies, merchandising?2 What risks do they face and how do those risk translate into a required return? What is going to happen to inflation and interest rates (which provide a bit of a baseline in the return investors need)? The list of questions goes on and on.
You aren’t going to be able to estimate the cash flows that Disney will generate next year, let alone every year for the rest of their corporate lifetime. Thus, your estimate of present value is wrong.
How wrong is it likely to be? The answer is probably more so than you might think. One of the key behavioral biases is overconfidence, which implies that our ability to estimate is notoriously bad. Ask people to rank their driving skill and they’ll tend to think they are better than average (as this businessinsider article states):
"Despite the fact that more than 90% of crashes involve human error, three-quarters (73 percent) of US drivers consider themselves better-than-average drivers. Men, in particular, are confident in their driving skills with 8 in 10 considering their driving skills better than average."
This same overconfidence causes us to overestimate our ability to predict the future.
If your estimate is wrong, does that mean it is worthless? The answer is a hard no. It’s still incredibly valuable for many reasons.
The first reason is that in order to develop the DCF model, you need to do some research. This should include going to the firm’s investor relations page and looking at their SEC filings (at least the most recent 10K and 10Q)3, conference call transcripts, investor presentations, industry analysis, etc. By doing this, you will gain a better understanding of the firm’s strategy/positioning and what MAY happen to sales, expenses, cash flows, and risk factors. You’ll have an idea who their competitors are and what type of environment they operate in. Note that you won’t KNOW what will happen, but you will at least have a general background to start creating some of your own insights.
The second reason is that it will force you to think about the range of things that could happen. For example, since we were talking about Disney earlier, what are their plans for upcoming theatrical releases? Do you anticipate that they will be better than consensus, match consensus, or be worse than consensus and what is your reasoning? You can play around with scenario analysis, where instead of just thinking about one outcome, you can split your forecasts into three outcomes (a bull case, base case, and bear case). Your bear case can include a couple of things that you think COULD go wrong, but are not necessarily expecting them to. The bull case can include a couple of things that could go right. Remember, lower probability events happen. Thinking about them now, better prepares you for handling them if they do occur.
Regardless of what you are calculating, it is essential to remember that the formulas assume that we KNOW what will happen in the future. We don’t. We merely have ideas about what we THINK is LIKELY to happen. There is far less certainty and precision than we would like to believe. Therefore, if you estimate that Disney is worth $200 per share, it is probably better to think of it as a range of prices rather than $200. Instead, you might think that it is worth between $150 - $250. If that seems like a wide range, it isn’t. To illustrate this, let’s look at returns for the S&P 500 from 2001 - 2020 (a twenty-year period). The best return was 2013 with a total return of 32.39% (2003, 2009, and 2019 each saw returns of more than 25% as well). The worst return was 2008 where the S&P 500 lost 37%. During that time period, the average annual return was about 7.5%.
If we look at returns for Disney over the same 2001 - 2020 time frame, we get an average annual return of 11% and a standard deviation of 25%. This means that in any given year, we should reasonably expect returns of -39% to 61%.4 There were 3 years of returns worse than -20% (2001, 2002, and 2008) and 6 years of returns above 30% (2003, 2006, 2009, 2012, 2013, and 2019). All of a sudden, that range of $150 - $250 doesn’t looks so big (as it is only 25% up/down from our price target).
The calculations in finance are partly about getting numbers. However, it is essential to think of those numbers as approximations rather than precise values. The degree of precision will vary quite a bit depending on what you are calculating (Net Present Value or Stock Value are both pretty rough, while things like Cost of Capital or Required Return should be a little more precise), but always take your result with the proverbial grain of salt. The benefit of doing the calculation is to make you think about what underlying assumptions/forecasts you are making, why you are making them, and what could go wrong with your analysis. In other words, the calculations are a way to frame the story you are telling so you can have a sense when that underlying story is changing. Remember to focus on your story.
Image source — https://www.wallstreetmojo.com/portfolio-standard-deviation/
To make this even more fun, remember that until 2012, Disney did not even own the rights to Star Wars and Disney+ was not initiated until 2017. I’m sure everyone factored that into their analysis of Disney when doing their 2010 DCF models, right?
The 10K is their annual filing with the SEC that describes the business, the risks, reports their financials, etc. The 10Q is their quarterly update for quarters 1 - 3 (the fourth quarter is presented as the 10K).
This is not technically accurate (again, false precision) as it assumes a standard normal distribution of returns and is looking at +/- two standard deviations from the mean. Unfortunately for us, stock returns are not normally distributed, so extreme events tend to occur more often than a standard normal distribution would predict.


