
Expected Return
What the hell is Goofy?

Before I start today’s newsletter, a quick shoutout to any new readers from last week’s interview with Khalen Dwyer of Honest Math (Substack reader counts were quite a bit higher). Now, hopefully you all won’t leave in droves as we’re back to my rambling.

TL;DR Summary
Expected return represents the average return we anticipate earning on an investment IF we could repeat the holding period an infinite number of times.
Unfortunately, we only get one “sample” of the holding period which may turn out better than normal or worse than normal…and sometimes by quite a bit.
Expected return does NOT tell us what we will earn or what our most likely outcome is…only the average.
Probability distributions (which are commonly taught in classes) are not something that are useful in virtually any real-world investment decision.
Instead, it is probably better to try to forecast a future price and use (a) your current purchase price, (b) any dividends received over the holding period, and (c ) your forecasted price to calculate the return you anticipate receiving on an annualized basis over the holding period.
The challenges of this include developing a reasonable future price (you need to consider how many years out you want to look, your anticipated multiple, and the basis for the multiple). I walk through an example with Dollar Tree to illustrate the process.


One of the things that is a standard part of teaching finance is going over how to calculate an expected return. While this is a great concept, it is one of those things that I’m guessing very few students are able to translate from the classroom to application in their investing decisions. There are multiple reasons for this, but most importantly it is a concept that poorly translates from textbooks to practical application. However, before we get into those reasons, let me start with what is likely to be a refresher for many of you (although, I’d encourage you to at least skim this next section even if you feel you have a good grasp on expected return) — what is expected return and what is it telling us?
What Exactly is Expected Return?
Does anyone remember the movie Stand By Me?
If you haven’t seen it, I’ll recommend it as one of my top-10 favorite movies…go ahead and add it to your “watch” list (unless you have a phobia of leeches). If you think of Stephen King as a horror writer, you are missing the man’s true talent…character development. There are tons of quotable moments from the movie, but one of my favorites is when the four kids are camping and get into an incredibly valuable topic — What the hell is Goofy?
This is how I imagine many business finance students (and later investors) think about expected return…a vague impression of the general idea, but they have a hard time really nailing it down. An expected return is the average rate of return you would earn on an investment over a given holding period (usually annualized) if you could repeat that holding period an infinite number of times. Imagine you were flipping a coin and you would lose 5% for the next year if it landed on tails and make 25% for the next year if it landed on heads. The expected return on this coin flip is 10%.1 In other words, if we could flip this coin 1,000,000 times, our average return would end up being almost exactly 10%.
However, here’s were it can get tricky. The term “expected” makes it seem like we should anticipate 10% as our most likely outcome. It is not. As a matter of fact, we can’t earn a 10% return on our hypothetical coin flip. Not only is it not the most likely outcome, it isn’t even a POSSIBLE outcome. If we flip the coin once, we are either going to lose 5% or we are going to make 25%…there is no scenario where we get a 10% return.
Let me share an analogy. Let’s assume that you are 6 feet tall, can’t swim, and are asked to walk across the length of a pool that is “on average” 3 feet deep. Since the water would only come up to your waist, this should not be a problem. However, it likely will be a problem if the pool has varying depth. If you think of a pool that has a shallow end of about 90% of the pool length is 2 feet and then a sudden drop off to where the last 10% is 12 feet deep, the pool is “on average” 3-feet deep.2 You can see where the concept of expected return can cause problems. You don’t need to know just what you are going to earn ON AVERAGE, you need to have some idea of how reliable this average return is. We’ll come back to this in the near future with a look at risk.
Now, let’s make it even trickier by assuming that we are not flipping a coin, but we are playing roulette.

Assume a standard roulette wheel with 2 green “house” numbers (0 and 00) and 36 regular numbers. Thus, if you bet $5 on black, you have 18 black numbers (which will allow you to win $5), 18 red numbers (which will cause you to lose $5) and 2 green numbers (which will also cause you to lose $5). Therefore, your expected payout is -$0.26.3 On a $5 bet, this is an expected return of about -5%. However, if you bet on a specific number (let’s say 20), your payoff is 35 to 1. This means that your expected payout is still -$0.26 for the same expected return. However, here your expected return is much riskier as you have a roughly 97.4% chance of losing your $5 (compared to a 52.6% chance when betting on black). When you do win though, you will end up winning a much higher amount. This provides some illustration of the concept of risk. That said, it is MUCH more difficult to apply in investment analysis as roulette allows us to know both the exact odds and payouts of any bet. With investments, we know neither one.
Moving Expected Return From Textbooks to Actual Investing
So, let’s say that you are considering investing in Dollar Tree.4 Remember that the process for estimating the expected return is to consider all possible outcomes during the time period, the probability of each of those outcomes, and the return that would occur for that outcome. Oh, and all of these outcomes need to be independent. In addition, you have to consider strategic initiatives. What new strategies is Dollar Tree pursuing? One is the introduction of Dollar Tree Plus (with $1, $3, and $5 price points instead of just their traditional $1 price point). Another would be combo stores (Dollar Tree combined with Family Dollar). How successful will these be and why? One of the challenges mentioned by Dollar Tree in their second quarter report was the impact of shipping. How much impact will it have and for how long? What about their competitive position in the marketplace? Will people just pick up stuff online with their WalMart order? Will they go to Dollar General? How about the impact of fiscal policy (for example child tax credits and the elimination of the extra unemployment compensation)? What about potential tax changes? How might the labor situation impact Dollar Tree’s costs (and those of their competitors)? What if there is a sudden resignation from management? How about the potential for a cybersecurity issue? The list goes on and on.5 As you can see, the list of possible outcomes is nearly infinite. Now, how likely is each of these outcomes? What if you assign something a 2% probability and it is really a 4% probability? How do you KNOW the correct probability (narrator — you don’t). Finally, what will the impact be on the stock price (which you need to know to generate the return for each outcome)? If you are starting to feel like the image below, you see the problem.

Does this mean that the concept of expected return is useless as a practical tool? Not necessarily. However, it does mean that it is probably useless from the perspective of calculating the expected return as taught in introductory finance courses of an individual stock. Instead, we can calculate expected returns by looking at dividend yields plus potential price increases. This was demonstrated in the (Un)reasonable Returns update from several weeks ago. While this works better for something like the S&P 500 (which is how it was applied), it can also be used for an individual stock. Again, let’s look at Dollar Tree. Dollar Tree does not currently pay a dividend. Their earnings forecast for 2023 (which is about 1.5 years out) is $6.37. You can see the Yahoo!Finance quote for Dollar Tree with the “Analysis” tab clicked (1) and the 2023 average estimate for earnings is $6.37.

Assuming a PE multiple of 15, this would give us a forecasted price of $95.50 (15*$6.37) for 1.5 years out.6 Dollar Tree closed Tuesday, Sept. 21st at $86.26. Therefore, we would have an expected return of 7%. You could argue that 1.5 years is too short of a holding period (and I would agree). If so, you would need to forecast earnings out for a bit longer.7 You also are going to have to use discretion to figure out the appropriate PE multiple to apply. Typically, the faster the anticipated growth and the lower the 10-year Treasury yield, the higher the PE multiple. Under a no-growth model with no dividends, a multiple of 15 would imply an expected return of about 6.7%.
Challenges With Expected Return
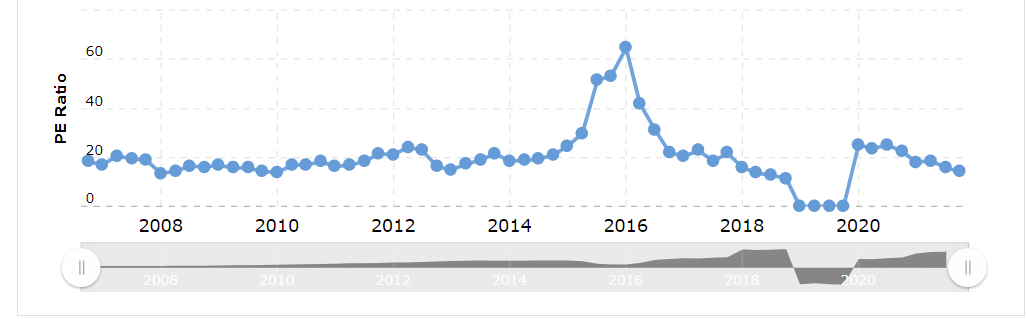
There are a couple of challenges with this type of expected calculation. While it makes a lot more sense than using a probability distribution, there is going to be a fair amount of noise. Let’s go back to Dollar Tree. I used a PE multiple of 15. However, what is the appropriate PE multiple to use? Macrotrends offers the following table with historical PE multiples for Dollar Tree. While the historical data is thrown off by their struggles in merging with Family Dollar and the COVID pandemic, if we just look at the recent numbers we get a range of 14.09 - 25.09. Choosing the “correct” PE multiple is going to be key to getting the future price used in estimating the expected return.
Another challenge is going to be getting the proper EPS forecast. If we are using a near-term EPS forecast (like we are here), we can use something like Yahoo!Finance to get the analyst consensus. In the case of Dollar Tree, we have something working in our favor. Specifically, the number of forecasts. If you look back at the forecast page, you will see that there are 26 analysts being used in the analysis. All else equal, a higher number of analysts will give us more reliable data.8 For perspective, something like GameStop only has 4 analysts. If you look at the low estimate, you see an EPS forecast of $5.82. Using a multiple of 15 would give us a price of $87.30 and an expected return of 0.8%. Alternatively, with the high estimate ($6.98) and a PE of 15 we would have a price of $104.70 and an expected return of 13.8%. Note that some companies are going to have wider ranges than others. For example, WalMart’s range is $6.20 - $7.12 (the high is less than 15% of the low) while Tesla’s is $4.25 - $10.00 (the high is 135% of the low!).
What if you want to go further out than 1-2 years for an EPS forecast? Then, you’re going to likely have to spend some time doing your homework. That’s okay, because you SHOULD be doing this before making a purchase anyway. Have you read through the most recent 10K and the quarterly updates? Have you read through the last two conference call transcripts? Do you know who the competitors are and what challenges/opportunities the industry is facing? What is the legal/regulatory environment? What is the total addressable market? And for this last one, please be realistic as a lot of companies tend to inflate the number. If I am looking at Dollar Tree, I want to think about how many stores they are likely to have. From their 2020 10K, you find this piece of information:
Over the long-term, we believe that the market can support more than 10,000 Dollar Tree stores and 15,000 Family Dollar stores across the United States, and approximately 1,000 Dollar Tree stores in Canada.
We also know from the 10K that as of the end of January 2020, there were 7805 Dollar Trees and 7880 Family Dollar stores. This would indicate that there is is room for expansion (more so in the Family Dollar arena). We also want to think about how profitable these stores are going to be. This is a function of net sales and margins (while there are other costs in there, remember that we aren’t going to be perfect). If they are increasing the number of stores based on the following schedule (from 2nd Quarter 2021 Conference Call Transcript — italics are mine):
Building on this continued success, we are planning to add Dollar Tree Plus to an additional 1,500 stores in fiscal 2022. And, we aim to have at least 5,000 Dollar Tree Plus stores by the end of fiscal 2024. Many of our new stores will also be opening up as Dollar Tree Plus stores. This past March, we announced that our newest store format, the Combo Store, leveraging the strengths of both banners under one roof, to provide shoppers with extreme value and merchandise excitement. These stores represent another way to introduce the multi price assortment to Dollar Tree shoppers, and the $1 assortment to Family Dollar shoppers, a major benefit from the Dollar Tree and Family Dollar combination.
We currently have 105 Combo Stores, and I believe we can reach 3,000 of these stores in rural markets alone. Demonstrating our great confidence in Combo Stores as a strategic format, more than 85% of our new Family Dollar stores will be Combo Stores in fiscal 2022. We anticipate 400 new, renovated or relocated Combo Stores next year. We are also in the process of validating the combo store concept and other demographic markets and are excited about the possibilities.
Our larger Combo Stores on average are delivering 23% more sales, 31% more gross margin dollars, approximately 120% more cash contribution dollars, and are reducing payback time by approximately 30%. New Combo Stores compared to similar size stores are showing sales increases of 17%, and even more encouraging, our renovated or relocated Combo Stores are delivering greater than 40% more sales when compared to Family Dollar stores that have not been renovated or relocated.
Remember, management tends to have an optimistic bias. While it is tempting to conclude that this is due to nefarious intent, that is probably not the case. I would argue that the majority of management is biased because it comes with the territory and most of us suffer from self-serving bias. Just remember that, while their forecasts may be tinted from rose-colored glasses, your job is to think about how realistic they are and adjust appropriately. With Dollar Tree, a reasonable approach may be to try to estimate 2024 EPS. The upcoming results are for 2021, so you are looking effectively 3.5 years out. However, this will give Dollar Tree time to work through the current supply constraint issues that they are facing and (ideally) return to a normal environment. If we assume that revenues will grow at about about 5% per year and net margins will be about 6%, we can forecast sales as about $31 billion in 2024 and net income of $1.85 billion. They currently have about 236 million shares outstanding which would ballpark EPS at about $7.88 per share. This would translate to a forecasted price of $118.22 and an expected rate of return of about 9.4% per year.
Conclusion
Remember that expected return does NOT tell us what we are going to earn. It does not even tell us the most likely outcome. Instead, it is an average if we could repeat that time frame an infinite number of times. Unfortunately, we don’t get to do that. I just watched the Ravens beat the Chiefs a couple nights ago and there were several fluky plays (as there are in virtually all athletic competitions). A Raven running back fumbled the ball near the goal line and it was caught in midair by his teammate for a touchdown. A Chiefs player got an interception because the Raven’s intended receiver slipped in front of him. In the final two minutes, the Chiefs had the ball in range for a long field goal that would have won the game…and fumbled. Then, on 4th and 1, the Ravens went for the first down instead of punting…and got it. Each of these plays could have turned out different, but in our universe, they didn’t. We don’t get to experience the Marvel Cinematic Universe with infinite outcomes. Instead, we only get one.

Because of the challenges in putting all the possible outcomes into a probability distribution, that is not really a worthwhile tool in the investor’s toolbox. Instead, if we want to think about expected returns, we need to think about it in terms of
What is a reasonable price I can expect at some point in the future?
What cash flows will I receive between now and then?
Given today’s price, the intermediate cash flows and the future price, what rate of return would this lead to?
Note that this exercise is not exact. Instead, it provides an approximation. The better your ability to project what is going to happen (disclaimer — it is harder to do well than we’d like to believe), the more reliable your expected return will be. Because it is hard to do well, it is worthwhile to have a diversified portfolio so that your errors are likely to cancel out.
Expected returns are calculated using the following formula where Pi represents the probability of outcome i and ki represents the return for that specific outcome.

Therefore, we have two outcomes tails and heads which each have a 0.5 probability of happening (50% chance). So, our expected return is 0.5(-5%) + 0.5(25%) = -2.5% + 12.5% = 10%.
Expected depth would follow the same formula as expected return, so you have 90% at 2 feet and 10% at 12 feet. This would be 0.9(2) + 0.1(12) = 1.8 + 1.2 = 3 feet. Granted, you could probably hold your breath for this 10% of the pool length, but go with me here.
You can calculate the expected payoff as follows: (18/38)($5) + (18/38)(-$5) + (2/38)(-5) = $2.37 + -$2.37 + -$0.26 = -$0.26
Disclaimer — the author owns a small position in Dollar Tree. This is not an investment recommendation. Investment opportunities (like favorite meals) are highly dependent on the individual. While you may love garlic, I can’t stand it.
Dollar Tree identifies 22 specific risk factors in their most recent 10K and clearly states that this is not an inclusive list of risks. It also does not list opportunities separately, which are additional outcomes to be estimated.
You could also use other multiples, such as P/S, EV/EBITDA, etc. I would avoid P/B as book values are less meaningful today than they were 20+ years ago. You could also use a Discounted Cash Flow model, but that is going to introduce even more noise.
Note that I would discourage you from forecasting EPS out beyond more than 5 years as your ability to forecast EPS at that point would probably be too low to add value relative to the noise of your forecast.
This is due to “The Wisdom of the Crowd” in which errors are more likely to cancel out.