
Arithmetic, Geometric, and Dollar-Weighted Returns and Indices
Tangled Webs of Deceit for the Unsuspecting


Time for a Poll
Apparently Substack decided to add polls, so I’m including one just for fun. While you can skip it, I just want to see how it works for future use. I think you have to pick the main reason (no double-dips), so give it a shot. It should be good for 3 days from publication.
Also, I want say “Thank You” to Steven Anderson for the questions that inspired today’s post. They are not complex, but a good refresher never hurts (especially if you are like about 100% of the students who were not always paying attention in Investments class…totally unlike me as a student 🤣). If anyone has questions — about anything, please feel free to ask…seriously, I can always use some topics to discuss!
Arithmetic vs. Geometric Returns vs. Dollar-Weighted Returns
When is a 10% return not a 10% return? The answer depends on how you are calculating returns. Today, we’re going to introduce three different returns and talk a bit about them.
Arithmetic Return
Let’s start with a series of three sets of returns as follows (slightly exaggerated to drive home the key information):
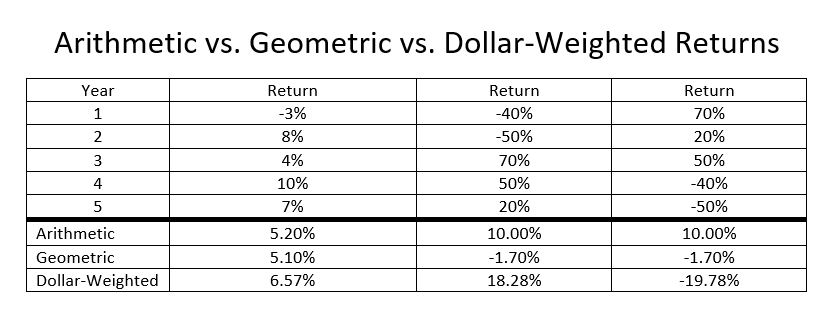
The arithmetic return is both the easiest (and the least useful) of returns as it ignores any compounding impacts. The formula for arithmetic return looks like this

So, to get the arithmetic return for the first set of returns, I would just add them up and divide by the number of returns (5 in this example). Therefore, add them up (-3% + 8% + 4% + 10% + 7%) = 26% then divide by 5 and we get 5.20%. Unfortunately, this misses the compounding impact, which we see when we jump to the second return stream. When I add up these returns (-40% - 50% + 70% + 50% + 20%), I get 50%. Divide this by 5 and I have an average return of 10%. AWESOME!!
Unfortunately, I didn’t actually earn a 10% return…I lost money. How do you lose money while “earning” a 10% rate of return? Because of the compounding impact. When I lose 40% in year 1, I do not get back to even with a 40% return in year 2. I’m actually still down by 16%. Instead, I need a 66.7% return to get back to even. If I start with $100 and earn a -40% return, I am down to $60. I need to get it back to $100, which means I need a $40 return (to recover my loss), but I only have $60 in capital. $40/$60 is a return of 66.7%.
Geometric Returns
This means that I need to take into account the compounding effect of returns to figure out what my return really is. The geometric return formula looks like this:

As you can see, the math is getting more complicated. However, it is also more accurate. Now, I can see that in scenario #1 my geometric return is really close to the arithmetic return. [(1 + -3%)(1 + 8%)(1 + 4%)(1 + 10%)(1 + 7%)]^(1/5) - 1 = [1.28235]^(1/5) - 1 = 1.0510 - 1 = 5.10%. However, the return from scenario #2 is quite a bit different. Here, I get [(1 + -40%)(1 + -50%)(1 + 70%)(1 + 50%)(1 + 20%)]^(1/5) - 1 = [0.918]^(1/5) - 1 = 0.9830 - 1 = -1.70%. This IS quite a bit different than my 10% arithmetic average.
Problems with Arithmetic Returns
The biggest problem with arithmetic returns is the lack of compounding. If we look at the return scenario #1, we can see that it is a low-variance (the numbers don’t change much from one period to the next) sequence. In this case, the arithmetic numbers will slightly overstate your return, but not by much (as in 5.20% vs 5.10%).
However, when you have volatile returns, the difference can be signficant. If I take a stock like SNOW (Snowflake) which closed at $401.89 on November 16, 2021 and fell to $113.30 on June 13th, 2022, you had a return of -71.8%. If the stock increases by 71.8%, you are now at $194.66…and still down 50%!1 The more volatile the stock returns, the greater the error you are going to receive using arithmetic returns. Geometric returns take a little more work, but are far better for looking at historical data.2
Dollar-Weighted Returns
Unfortunately, for most of us, neither arithmetic or geometric returns are ideal. The reason for this is that we don’t invest that way. Instead, we put money into stocks over time. If you start investing at age 25, you have 35 years until you’re 60. So, let’s assume you plan to invest a total of 9% of your income over the next 35 years. You currently make $60,000/year and are going to see your income rise by 3% each year. How do you figure your rate of return? The answer is dollar-weighted returns.
This is the trickiest one because you can only solve up to the current year.3 Let’s look at scenario #2 and scenario #3 in the examples above and assume that you are putting in $5000 at the start of each year.

Let’s go throught these two examples, starting with scenario #2. In our first year, we contribute $5000 and it loses 40%, which is going to leave us with $3000. Then we add year two’s $5000 to give us $8000 and lose another 50% (not a great start) to give us $4000. Finally, we get a decent year in year three with a 70% return. So we start year 3 with $9000, get the 70% return and we are up to $15,300. Year 4, we add our next $5000 and supplement it with a 50% return to bring us up to $30,450. Finally, in year 5, we add our last $5000 and get a 20% return to give us $42,540.
Now we know that we have put in -$5000 per year (our PMT) for 5 years (N) and ended up with $42,540 (FV). Because we put our payments in at the beginning of each period, we need to set the calculator to BEG (for beginning of year payments) and solve for our I/Y. Note that we do not have a PV, so we are going to enter a zero. It will look like this:
SHIFT BEG 5 N -5,000 PMT 0 PV 42,540 FV ==> Solve for I/Y and get 18.28%
Repeat this for scenario #3 and you will end up losing 19.78% per year
SHIFT BEG 5 N -5,000 PMT 0 PV 13,450 FV ==> Solve for I/Y and get -19.78%
Why are the results so different? If we look at arithmetic returns and geometric returns, we end up with the same values (10% arithmetic and -1.70% geometric). However, this ignores the fact that our money invested is growing over time as we put in a new $5000 every year. In scenario #2, we get in our “bad” years early on before we have much money to be impacted. However, in scenario #3, we have our “good” years early on and the “bad” years at the end. Timing of returns matters a LOT in your outcome. This is why something like honestmath.com is so essential. It allows for randomness in returns (we don’t know what the future holds) to impact our outcomes under a simulation.
The point is that when you are putting money away, you want your bad years early on (returns are not constant…8% expected return does not mean you are going to earn 8% every year). Then, once you retire, you want your bad returns to occur later on. If only life cared what we want. Timing randomness is not predictable (strange but true fact 🤣🤣), but it is in your interest to be aware of it, so you can adjust your savings/spending habits if returns do not move in your favor.
Price-Weighted vs. Value-Weighted Indices
The other question had to do with indices. The two biggest indices are the Dow Jones Industrial Average and the S&P 500. If you’re reading this, I’m sure you are familiar with both of them. The first point is that they are very differently constructed, but behave similarly.
Dow Jones Industrial Average
Let’s start with the Dow Jones Industrial Average. It was created way back in May 26th, 1896.4 The original companies were
American Cotton Oil Company
American Sugar Refining Company
American Tobacco Company
Chicago Gas Company
Distilling & Cattle Feeding Company
General Electric
Laclede Gas Company
National Lead Company
North American Company
Tennessee Coal, Iron and Railroad Company
United States Leather Company
United States Rubber Company
I think we have one of those twelve companies still in existance (kudus to GE). One of the keys to the DJIA that make it unique (remember…1896 was a bit before Excel) is that it needed a simple way to calculate the average. What is simple? How about adding up the prices and dividing by twelve.5 This is what is known as a price-weighted index. We’ll get back to why this is a potential problem later.
Over the years, there have been several changes in the Dow as companies were acquired, became too small, or for strategic reasons.6 The most recent changes were replacing Exxonmobil, Pfizer, and Raytheon with Salesforce.com, Amgen, and Honeywell on August 31, 2020. As a side note, the three stocks that were dropped have had returns of 142%, 53%, and 61%. The three replacements have had returns of -32%, 2%, and 12%. Small sample size and all, but as you can see the ability to improve the index by picking the “best” stocks doesn’t work out near as well as you might expect (repeat after me…markets are pretty damn efficient!). The current list of Dow Jones Industrial Average stocks can be found here.
Let’s go back to the price-weighted concept because it is important. Let’s consider Apple, which was added to the Dow in 2015 (not long after a 7 for 1 split in 2014). It continued to perform well and climbed to $499.24 on August 28, 2020 before it’s 4-for-1 split over the weekend, dropping the price to $124.81. This caused Apple’s influence on the Dow to drop from about 12% to 3%. Note that the value of Apple’s stock did not change, just the price changed. So a 10% upward movement in Apple (assuming the other stocks remained unchanged) would lead to a 1.2% movement in the Dow on August 28th, 2020 (compared to a 0.3% movement in the Dow on August 31st, 2020).
As you can see, there is no reason for Apple to have 4 times the impact on one day than the next other than the stock split (which shouldn’t impact value at all as it merely splits 1 share into 4 shares). As of Friday June 24th close, United Healthcare traded for $495.64 and Intel traded for $38.61 which means that United Healthcare could rise by 1% ($4.96) and Intel fall by 10%( -$3.86) and the DJIA would be up for the day.
Another problem with the price-weighted index is that it only represents 30 companies out of around 4000 in 2020 (no, I didn’t actually count them). So, we are accounting for less than 1% of all the stocks, which hardly represents a diversified portfolio. Then again, maybe it does. If I look at the DJIA, it includes Apple, Microsoft, Johnson and Johnson, United Healthcare and Visa (5 of the top 10 largest companies according to this site). These 5 companies account for $5.67 trillion (out of a total of $41.75 trillion) or 13.58%. Add in the rest of the DJIA and you are covering a reasonable size of the market. We’ll see that the same holds for the S&P 500, but the numbers are even more top-heavy as all of the top-ten are included. So, it is not 100% diversified, but does a reasonable job.
S&P 500
The S&P 500 is a value-weighted index of 500 companies. It has been publicly traded since Monday, March 4, 1957. Interestingly there are 505 stocks due to some companies having more than one type of stocks — such as GOOG and GOOGL — which bother represent Alphabet (go figure that one out). You can see the list of stocks here. I’m not going to go through recent changes, since it changes multiple times throughout the year (about 17 times as often as the Dow).
The S&P 500 has two significant advantages over the DJIA. First, it has 500 companies rather than 30. While this still is only a fraction of the 4000 publicly traded companies (give or take), it represents a significant portion of the market capitalization. The second distinction is that in order to calculate the value of the index, you divide the total market capitalization by a divisor (which changes on a constant basis due to share issuances, capital structure issues, and other changes).
While you would think that having 500 stocks would provide a better measure of diversification than 30 (and you would be right to a very small extent), it is not as big of a difference as you might think. Here is a correlation of the DJIA and the S&P 500 over the past 5 years based on weekly returns — 0.97. As you can see, it is VERY close to 1.0 (which is the maximum). The reason is that (a) market forces are a big driver and, more importantly, (b) they both represent large-cap stocks which are going to tend to move together. While more institutions may look at the S&P 500 (or many other individual indices), the actual index is not going to make a big difference in your return. This is because the 10 largest companies are all part of the S&P 500. They represent 24.4% of the total market capitalization of the US market. This is also true (although to a lesser extent) for large-cap vs small-cap indices as the S&P 500 and Russell 2000 (large-cap vs. small-cap indices have a correlation of 0.88 over the past five years on weekly data).
The other factor is the market capitalization weighted stock returns. Apple is going to be a bigger proportion of most people’s portfolio than PlayAGS (AGS). C’mon, everyone knows about PlayAGS (which I discovered by randomly picking a stock in the Russell 2000), right?
That is because Apple represents over $2.29 trillion in market capitalization while PlayAGS represents $213 million. In other words, Apple’s market capitalization is 10,000 times that of PlayAGS (actually a little more). Therefore, a 1% move in Apple is going to add about 10,000 times the overall capital to the market as a move in PlayAGS and SHOULD be weighted more heavily in an index trying to tell us what the market is doing.
Also, because stock splits don’t change market capitalizations, a four-for-one stock split in Apple will not influence the denominator in the index. We do have to make an adjustment in a price-weighted index, but not in a value-weighted index. Thus, stock splits are no longer essential. We do still need to adjust for stock substitutions.
Problems with Indices
Remember that indices tell us what markets HAVE done. I can look at the S&P 500 and tell you that since 1970, the S&P 500 has lost value (including dividends) in 10 years (out of 52). It’s 25-year average return through 2021 has been 9.76%. These tell me what markets HAVE done. What you want to know is what they WILL do (unfortunately “have” and “will” are two very different factors). We can assume a 10% return if we are following history. Personally, I’d go with 8% returns going forward just because I tend to be skeptical, but that is about as handy as asking your magic 8-ball. Just remember, there is no need to hedge against the zombie/nuclear apocolypse. I doubt your financial future will be that important in such a world, so I think we can safely ignore -100% returns. Instead, you might want to hedge a bit by investing in a few different asset classes. These include bonds, real estate, gold, farmland, cash or even Bitcoin.7 While stocks will always represent my biggest asset class, it does make sense to include a few other alternatives.
Good news…it’s currently partway there at $145 as I type this on Tuesday.
The exception occurs when calculating standard deviation of returns as you want to use arithmetic for that calculation. The reason is that you are looking at how much deviation there is from the arithmetic return, not the geometric return. It can get a bit complicated.
None of these are for expected returns, only figuring out what your return has been.
This was when the “Industrial” was added. The Dow Jones Index was created on February 16th, 1885.
This has changed over time due to stock additions, stock splits, and stock changes. Instead of dividing by 12, it is now divided by 0.15172752595384 — approximately. 🤣🤣
Strategic is somewhat open for debate as it can be due to problems with company or due to trying to choose “better” stocks. That said, I doubt if there is a lot of “let’s choose the company that will perform the best” rather than “let’s choose the company that fits the makeup of the Dow” best.
Please keep your Bitcoin exposure small (as in less than 5% of your portfolio). My personal opinion is that it is a solution in search of a problem. That said, the key here is “personal opinion” which means nothing in terms of actuality. A small position in Bitcoin (I have zero) is not automatically a bad idea (and may be a good one). Please stay FAR away from the other crypto securities (other than maybe Ethereum). Again, I’m keeping my exposure at zero and this is NOT a recommendation for adding any cryptocurrencies to your portfolio!